
Understanding the Latest Auto Accident Statistics
Driving is part of everyday life in America, but it carries real risk. Each year, millions of people are hurt and thousands are killed in car accidents.
Pedestrian and car accident deaths were higher in the U.S. than they were for many other high-income countries, according to auto accident injury statistics from the Centers for Disease Control and Prevention (CDC).
Find out the latest statistics about car accidents:
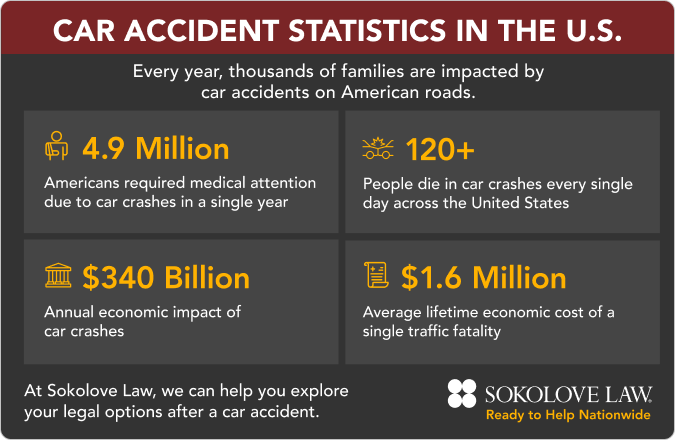
- Roughly 4.9 million Americans suffered injuries that required medical attention as a result of car crashes, per the National Safety Council (NSC).
- Over 120 people die in car crashes each day in the U.S., according to the CDC.
- Car crashes cost the U.S. economy an estimated $340 Billion in 2019 and roughly $1.4 Trillion when quality-of-life losses are included.
- The average lifetime economic cost of a single traffic fatality is approximately $1.6 Million, according to the NHTSA.
The impacts of car accidents can be long-lasting, with many families facing lengthy recovery times from injuries, chronic pain, and associated medical expenses. In severe auto accidents, loved ones may pass away or be left permanently disabled.
At Sokolove Law, our car accident attorneys help families pursue compensation for medical bills, pain and suffering, and more. With over 45 years of experience and $10.6 Billion total recovered for clients, we’re prepared to fight hard for you.
Let Sokolove Law help you pursue compensation after a car accident. Call (800) 995-1212 now to get started with a free case review.
Car Crash Causes Statistics
Drivers have a duty to properly judge what they’re doing on the road. When they don’t, their actions or inactions could cause serious accidents. A wide range of factors involving human error can lead to preventable car crashes.
In fact, the NHTSA has identified 18 unique mistakes that drivers make that cause car accidents, with these being the most significant:
- Distracted driving: 3,208 people were killed in crashes involving distracted drivers in 2024.
- Drunk driving: 11,904 people died in alcohol-impaired driving crashes in 2024.
- Reckless driving: Aggressive or reckless decisions accounted for 1.5% of car accidents.
- Speeding: Speeding-related fatalities increased 16% from 2019 to 2024, even as overall traffic deaths declined.
If a car accident wasn’t your fault, you may be entitled to compensation for medical bills, property damage, lost income, and more.

“My legal team constantly reached out to make sure I was okay and doing better, with no strings attached. That made me feel comforted and like they genuinely cared about me.”
– Alexandra, Car Accident Survivor & Firm Client
Distracted Driving Statistics
Anything that takes a driver’s eyes, hands, or attention off the road, such as texting, eating, adjusting the GPS, or interacting with passengers, can greatly increase the risk of a crash.
Various types of distracted driving account for 17.7% of driver-caused crashes, per the NHTSA. In 2021, distracted driving accounted for 8% of all fatal U.S. car accidents.
Key statistics on distracted driving include:
- 9 people die per day from distracted driving in the U.S. alone.
- 37% of drivers admitted to talking on the phone while driving and 34% had sent a text or email, according to the AAA Foundation for Traffic Safety.
- Drivers using cell phones are 5.36 times more likely to get into a car accident, according to the University of Utah.
- Drivers who are texting are 23.2 times more likely to cause an accident or almost cause an accident, according to Virginia Tech.
- About 10% of distracted drivers in fatal crashes in 2024 were between the ages of 15 and 20, per the NHTSA.
- 26% of rear-end collisions involved distracted drivers, as noted in a NHTSA report.
“Anything that takes your attention away from driving can be a distraction. Distracted driving is preventable. Do not multi-task while driving.”
– Centers for Disease Control and Prevention
Distracted driving rates involving electronic devices have slowly increased, jumping from 2.2% in 2015 to 4.5% in 2024, per the NSC.
Drunk Driving Statistics
Alcohol-impaired driving remains one of the leading killers on U.S. roads. Despite decades of public education and stricter enforcement, roughly 32 people die in drunk driving crashes every day, or 1 person every 44 minutes, according to the NHTSA.
When blood alcohol concentration (BAC) reaches 0.8 grams per deciliter (g/dL), the risk of serious car accidents is much higher. For this reason, a majority of states consider this to be the limit for drunk driving charges.
Statistics about drunk driving include:
- Drunk drivers were involved in approximately 30% of all traffic fatalities in 2024, per the NHTSA.
- An additional 2,028 people were killed in crashes involving a driver with a BAC of .01 to .07 g/dL — below the legal limit but still impaired.
- 29% of young drivers ages 15 to 20 killed in crashes in 2024 had BACs of .01 g/dL or higher, despite all being below the legal drinking age.
- Minimum drinking-age laws have saved an estimated 31,959 lives between 1975 and 2017, per the NHTSA.
- Drunk driving deaths declined for the third consecutive year in 2024, as noted by the Foundation for Advancing Alcohol Responsibility.
If you’ve been in a car accident caused by a drunk driver, you may be entitled to financial compensation. Call (800) 995-1212 to find out if Sokolove Law can help.
Reckless Driving Statistics
Reckless driving covers a wide range of behaviors. Tailgating, weaving through traffic, running red lights, and driving while tired or drowsy could all lead to otherwise preventable accidents.
In other cases, drivers hit another car or pedestrian but flee the scene, which is known as a hit-and-run and is typically considered a crime.
Find out about reckless driving statistics:
- 14.5% of all crashes in 2022 involved a hit-and-run driver, higher than 12.1% in 2019, according to the NHTSA data analyzed by Pew Research Center.
- Rates of fatal hit-and-run crashes also increased to 7.3% from 5.9% in the same time frame.
- In the post-coronavirus pandemic era, 49% of people believe drivers are behaving more recklessly than before.
- Roughly 6,400 people die each year from drowsy driving, per the National Sleep Foundation.
- Teens aged 16-19 are nearly 3 times more likely to be involved in a fatal crash. This is more than any other age group, per teenage reckless driving statistics from the CDC.
When a driver chooses to drive aggressively, recklessly, or while exhausted, they put every other person on the road at risk. Victims of these crashes may be entitled to compensation for medical bills, lost wages, and pain and suffering.
Speeding Statistics
Speeding remains one of the deadliest behaviors on American roads, dramatically increasing both the likelihood and severity of a crash, according to Pew Research Center data.
Maintaining legally acceptable or lower speed limits is crucial to help limit car accidents associated with speeding, per the NHTSA.
Statistics for speeding include:
- Speeding was a factor in 29% of all traffic fatalities in 2024, accounting for more than 11,000 deaths, according to the NHTSA.
- 37% of motorcyclists involved in fatal crashes in 2024 were speeding, compared to 22% of passenger car drivers, per the U.S. Department of Transportation.
- 70% of drivers considered themselves to be frequent or occasional speeders, as noted in the NHTSA surveys.
- 87% of drivers surveyed believed more needed to be done to reduce speeding.
- The rate of fatal car crashes increased by 17% in a 1-year period, according to the NHTSA.
“The higher the impact speed, the greater the fatality and injury risk to pedestrians and other non-motorists, and this risk starts rising dramatically at speeds above 20 to 25 mph.”
– National Highway Traffic Safety Administration
Rates of speeding-related traffic deaths have started to slowly decrease since a minor spike during the COVID-19 pandemic, per the NSC. More work must be done to reduce speeding and keep everyone safe on the roads.
U.S. Car Accident Statistics
American car crash statistics show that rates of fatal and non-fatal crashes are higher than in many other countries.
In fact, CDC data points reveal that traffic fatalities increased by 22.5% in the U.S. over a 9-year period, while in other high-income countries, the fatalities decreased by 19.4%.
Key statistics for car accidents in the U.S. include:
- The U.S. reported 14.2 road deaths per 100,000 people, according to the World Health Organization (WHO).
- This was much higher than countries like Canada (4.7), Australia (4.5), Germany (3.3), and the United Kingdom (2.4).
- The overall rate of fatal car accidents in the U.S. increased by 11.3% between 2019 and 2023, according to the NSC.
- The U.S. had a car accident rate 2.3 times higher than other leading developed countries, according to the CDC.
- The rate of fatal car accidents was higher in the U.S. compared to other countries, sitting at 1.21 per every 100,000 vehicles.
- The average fatality rate internationally was just 0.71 per every 100,000 vehicles.
At Sokolove Law, we may be able to help clients whose lives were changed by car accidents across the country. With law offices throughout the U.S., we’re ready to assist you no matter where you live.
Let Sokolove Law Fight for You
We’ve helped thousands of families secure justice and compensation for injuries caused through no fault of their own. Let us fight for you.
Car Accident Statistics by State
Auto accident statistics by state show wide variations in crash and fatality rates. Differences in road design, speed limits, seat belt laws, urban density, and law enforcement can all potentially impact car accident rates across various states.
No matter where you live, it’s important to understand car accident statistics and steps that you can take to stay safe, such as wearing seatbelts and avoiding risky driving behaviors.
Notable car accident statistics by state include:
- In 2024, the NHTSA found that car crash fatalities dropped in 35 states. Rates increased in 14 states and the District of Columbia.
- Car accident death rates decreased by more than 15% in 9 states and the District of Columbia for 2025, per the NSC. Those included California, Rhode Island, Iowa, Minnesota, Mississippi, New York, Connecticut, Maryland, and South Dakota.
- 8 states reported increases in car accident death rates for 2025: Hawaii, Wyoming, Kansas, New Mexico, Idaho, Vermont, Louisiana, and Colorado.
- Hawaii had a 25% increase in car accident deaths during 2025, the highest of any state. The District of Columbia had the biggest decrease at 52%.
- A major highway known as I-95 in Florida is considered to be the deadliest road in America, according to WPTV News. There is an average of 284 deaths per year on this road, per NTSB data.
Below, we’ve compiled information about the states with the highest and lowest crash rates throughout the country.
Top 10 States with the Most Car Accidents
Texas leads all 50 states with the highest number of fatal car accidents, sitting at 4,291 for 2023 according to the Insurance Institute for Highway Safety.
Other larger states like California and Florida have also recorded a significant amount of car accident deaths.
| State | Number of Fatal Car Accidents |
|---|---|
| Texas | 4,291 |
| California | 4,061 |
| Florida | 3,396 |
| Georgia | 1,615 |
| North Carolina | 1,561 |
| Tennessee | 1,323 |
| Arizona | 1,304 |
| Ohio | 1,242 |
| Illinois | 1,241 |
| Pennsylvania | 1,211 |
Eight of the top 10 states with the highest recorded car crash fatality rates are also among the top 10 states with the highest population. Only Tennessee and Arizona are not among the top 10 most populated states, per the World Population Review.
Top 10 States with the Highest Car Crash Rates
The Insurance Institute for Highway Safety (IIHS) has compiled data for all 50 states’ fatal car crash rates.
The top 10 states with the highest number of deaths per 100,000 people were either in the southern or western parts of the United States.
| State | Fatal Car Crash Rate Per 100,000 People |
|---|---|
| Mississippi | 24.9 |
| Wyoming | 24.7 |
| New Mexico | 21.0 |
| South Carolina | 19.5 |
| Arkansas | 19.4 |
| Alabama | 19.1 |
| Tennessee | 18.6 |
| Oklahoma | 17.7 |
| Arizona | 17.5 |
| Kentucky | 17.5 |
Mississippi’s death rate was over 5 times greater than Massachusetts, which has the lowest fatality rate of any state.
Top 10 Safest States to Drive In
The IIHS found that many of the states with the lowest fatal car crash rates were on the East Coast and in New England. All of the safest states reported fewer than 10 deadly crashes per 100,000 people.
| State | Fatal Car Crash Rate Per 100,000 People |
|---|---|
| Massachusetts | 4.9 |
| New York | 5.8 |
| New Jersey | 6.0 |
| Rhode Island | 6.5 |
| Hawaii | 6.5 |
| Minnesota | 7.2 |
| New Hampshire | 7.9 |
| Utah | 8.2 |
| Alaska | 8.2 |
| Connecticut | 8.5 |
Many of these states share key features, such as strong seat belt laws, well-developed urban transit, lower rural mileage, and stricter impaired-driving enforcement.
The wide gap between the safest and most dangerous states shows that traffic fatalities are not inevitable. Targeted laws, infrastructure improvements, and enforcement strategies can help to reduce deaths on the road.
Car Accident Statistics by Vehicle Type
The type of vehicle you drive significantly affects your risk of injury or death if you’re involved in an accident. Risky behaviors like not wearing seatbelts or driving while impaired increase the chances of serious injury or death across many types.
Larger, heavier vehicles can potentially protect their occupants better depending on the type of crash. Smaller vehicles like motorcycles may be more dangerous.
Here’s what to know about car accident statistics by type of vehicle:
- Motorcycles: Those riding motorcycles accounted for 16% of all traffic fatalities in 2024.
- Passenger vehicles: 82% of all car accidents in 2023 involved passenger cars such as SUVs and vans, according to the NHTSA.
- Pickup trucks: This type of vehicle has the second-highest fatality rates, only behind passenger vehicles.
- SUVs: Between 2013 and 2022, the percentage of fatal accidents involving SUVs or pickup trucks rose by almost 62%, per Policygenius.
- Semi-trucks: Large trucks were involved in 12% of all fatal motor vehicle accidents, according to the Bureau of Transportation Statistics (BTS).
Below, get a better understanding about the potential risks that each type of car poses and find ways to stay cautious no matter which vehicle you’re driving.
Motorcycle and Car Accident Statistics
About 5,000 motorcyclists die each year. Additionally, riders are 24 times more likely to die in a crash than those in passenger vehicles. A motorcycle offers almost no physical protection in a crash, according to the NHTSA.
The NHTSA notes that as motorcycles have become more popular, so too has the number of riders involved in serious or deadly crashes. Motorcycles are harder to see on the roads due to their smaller size, putting riders at risk of collisions with bigger vehicles like trucks.
Explore motorcycle accident statistics:
- 6,228 motorcyclists were killed in U.S. traffic crashes in 2024, the highest rate of motorcycle deaths since 1975, per the NHTSA.
- Of fatal accidents, 35% of motorcyclists didn't have a valid license in 2024.
- 40% of motorcyclists killed in crashes were under the influence of alcohol in 2024.
- Helmets reduce motorcycle deaths by 22% to 42% and brain injuries by 41% to 69%, NHTSA research shows.
- The fatality rate for motorcyclists in 2023 was approximately 31.39 deaths per 100 million miles traveled, compared to just 1.10 for passenger car occupants, which is about a 28-fold difference.
Passenger car occupants benefit from steel frames, airbags, crumple zones, and seat belts. Motorcyclists depend almost entirely on helmets and protective gear.
When a motorcyclist is struck by a car, the rider could bear the full force of the crash. Motorcyclists involved in crashes may face devastating injuries through no fault of their own.
Passenger Vehicle Statistics
Passenger cars remain the most common vehicles involved in U.S. traffic crashes. Of the 10.9 million vehicle accidents reported in 2023, passenger vehicles were involved in 8.9 million of them, according to the NHTSA.
Explore passenger car accident statistics:
- 22,713 passenger vehicle occupants were killed in U.S. traffic crashes in 2024, according to the NHTSA.
- 47% of passenger car drivers killed in 2024 were not wearing seat belts.
- Rates of car accident fatalities were the highest for those in passenger cars, sitting at 11.61 per 100,000 according to 2023 data.
- 82% of those ejected from passenger vehicles during an accident died, according to the NHTSA.
While technological advancements like sensors and rear-view cameras have made modern cars safer, safe driving behavior like wearing a seat belt and avoiding distractions goes a long way to keeping those in passenger vehicles safe.
Pickup Truck Accident Statistics
Pickup trucks accounted for the second-highest number of fatalities by any type of car, with a rate of 7.67 fatalities per 100,000 people, according to the NHTSA.
Pickup trucks have consistently topped the list of vehicles with the highest fatality rates in accidents where seatbelts weren’t worn for nearly two decades, per the NHTSA.
Learn more about pickup truck crash statistics:
- 59% of pickup truck occupants killed in 2024 were not wearing seat belts, the highest rate of any vehicle type, per the NHTSA.
- Pickup trucks accounted for a disproportionate share of rollover fatalities, due in part to their higher center of gravity.
- 38% of rollover deaths involved those driving or riding pickup trucks, the highest of any other vehicle type, in 2023, per the NHTSA.
- Wearing a seatbelt reduces the risk of death in a truck accident by 60% and the risk of serious injury by 65%.
The myth that a larger vehicle automatically means a safer one persists, but the numbers tell a different story, according to the NHTSA. Without seat belt use, even the biggest pickup offers little protection in a serious crash.
SUV Accident Statistics
SUVs, along with pickup trucks, are more likely to be involved in fatal single-vehicle accidents, according to the IIHS.
SUV passenger deaths have increased by nearly 15 times from 1975 to 2023, corresponding with this type of vehicle’s rise in popularity.
Find out about more SUV crash statistics:
- 47% of SUV drivers killed in 2023 were unrestrained, according to the NHTSA.
- SUVs had just 11 deaths per million registered vehicles that were less than 3 years old, the lowest among all passenger vehicle types, per the IIHS.
- Because SUVs are heavier than other passenger vehicles, there’s a lower risk of dying if involved in a multi-vehicle crash.
- The odds of an adult pedestrian or cyclist being killed increase by 44% if they’re hit by an SUV, according to the journal Injury Prevention. The risk increases significantly if the pedestrian or cyclist is a child, rising to 82%.
Researchers noted that if all SUVs were replaced with passenger vehicles, roughly 10% of fatalities or serious injuries involving pedestrians or cyclists in the USA would be prevented.
As SUVs continue to dominate U.S. roads, their impact on pedestrian safety and rollover risk has drawn growing scrutiny from regulators and safety advocates.
Semi-Truck Accident Statistics
During 2023 alone, 153,452 people were hurt in large truck accidents and 5,472 people died, per the NHTSA. Around 87% of those harmed in trucking accidents were either in other vehicles or pedestrians, as noted by the BTS.
Learn more about truck accident statistics:
- In 2023, 70% of those who were hurt in truck accidents were the occupants of other cars or vehicles, per the NHTSA.
- The rate of drunk driving was lower among truck drivers compared to drivers of other vehicles.
- Just 4% of all truck accidents involved drivers with BACs of 0.8 g/dL or more.
- 71% of trucks that were involved in deadly car accidents during 2023 weighed 26,000 pounds or more.
- Every 15 minutes, someone is killed or injured by a tractor-trailer in the U.S.
- Passengers of non-commercial cars or vehicles are 6 to 10 times more likely to be injured or killed when hit by a truck.
If you’ve been hurt in a crash with a commercial truck, you may be able to file a truck accident lawsuit to seek damages.
At Sokolove Law, our truck accident attorneys can assess your case, build a lawsuit on your behalf, and work to recover the highest compensation possible if eligible.
Involved in a Truck Accident?
Connect with our commercial truck attorneys to explore your legal options. Get a free case review now to find out if our team can fight for you.
Auto Accident Injury Statistics
Roughly 5 people are injured per minute in car accidents, according to the NHTSA. Even non-fatal crashes can leave victims with injuries, some of which can lead to long-term or lifelong impairment.
Around 4.9 million people sought medical attention for crash-related injuries in 2024 alone, according to the NSC. The expenses associated with these medical visits exceeded $559.3 Billion.
Explore more car accident injury statistics:
- The most common injuries reported from car accidents are neck sprains, according to the IIHS.
- 63.1% of pediatric spinal fractures occur in children between the ages of 15 and 17, with motor vehicle crashes as the leading cause.
- 20% to 45% of those involved in car accidents went on to develop post-traumatic stress disorder (PTSD), according to the International Journal of Environmental Research and Public Health.
- Car accidents account for around 17% of traumatic brain injuries, per the CDC.
Many of these injuries, particularly brain and spinal trauma, can require a lifetime of medical care, rehabilitation, and lost earnings.
Pursuing a car accident lawsuit can help victims and their families cover those long-term costs and hold the responsible parties accountable.
Car Accident Statistics by Age
While people at any age are at risk of getting in an auto accident, car crash rates generally decrease with age, per the NSC.
Here are auto accident statistics by age:
- The fatal crash rate per 100 million miles was 2.15 for those aged 20 to 24, according to a study from AAA.
- The safest age group for drivers was 60 to 69, per AAA, with a rate of just 1.04 crashes per 100 million miles.
- The number of drivers with a license gradually increases between the ages of 16 to 24 while the crash rate per 100,000 drivers decreases.
- The fatal crash rate for those aged 16 to 19 was 4.5 times greater than those aged 30 to 59, per AAA.
- AAA found that the lowest rate of driver deaths was among those in their 30s.
- 13% of all passengers who died in auto accidents were between the ages of 13 and 19.
- Between 2012 and 2021, the rate of young adults aged 15 to 20 involved in fatal car accidents increased by 18%.
- In 2022, there were nearly 52 million licensed drivers aged 65 or older, marking a 77% increase from 2004, per the CDC.
Some age groups face higher crash risks than others. Teen drivers and elderly drivers are both overrepresented in fatal crash data, though for different reasons. Learn more about car accident statistics regarding these age groups below.
Teen Driver Car Accident Statistics
Teenagers (those aged 16-19) only account for 3.8% of licensed drivers, according to the NSC. However, they’re significantly more likely to be involved in car accidents.
Teens make up 8.8% of drivers who get into crashes, and are behind the wheel in 6.8% of all fatal accidents. Car crashes remain the #1 cause of preventable death for U.S. teens, according to the NSC.
Learn more about teen driver crash statistics:
- Crash rates among drivers aged 16 to 17 were almost double those of drivers aged 18 to 19, according to AAA.
- 1% of all 16-year-old drivers are involved in car crashes, per the NSC. The percentage slowly rises with age to 2.3% by the age of 20, before remaining steady through age 22.
- Driver fatalities among teens peaked at the ages of 18 and 19, which recorded 1.9 deaths per 1,000 drivers, according to the NHTSA.
- 57% of those who died between the ages 13 to 19 were riding in cars driven by teens also aged 13 to 19.
- Roughly 2,800 teens between the ages of 13 and 19 died in car accidents during 2020 alone, according to the CDC. Approximately 227,000 teens suffered accident-related injuries that same year.
- Teens aged 16 to 19 are at the highest risk of getting into car accidents. The fatal crash rate for this group is nearly triple that of drivers aged 20 and older per corresponding miles driven.
- 29% of drivers aged 15 to 20 who died in an automobile accident were drinking, per teenage drunk driving statistics from the CDC.
- 62% of drivers between the ages of 15 and 20 who died behind the wheel after using alcohol weren’t wearing their seat belts.
Inexperience, peer influence, and underdeveloped impulse control make teen drivers uniquely vulnerable. Strict licensing programs, parental rules, and consistent seat belt use are among the most effective ways to potentially bring these numbers down.
Elderly Car Crash Statistics
While fatal crash rates per 100,000 licensed drivers tend to slowly decrease with age, the same can’t be said for those aged 75 or older, per the NSC. Among these drivers, the rate actually goes up.
Around 25 older adults die per day in car accidents, and over 740 are hurt, according to the CDC.
Statistics on car crashes involving senior citizens include:
- During 2022 alone, roughly 9,100 older people died in auto accidents and more than 270,000 needed to go to the emergency room for injuries, per the CDC.
- Drivers aged 80 or higher had the highest death rates, per AAA.
- Drivers over the age of 70 have higher death rates because they’re more likely to suffer more fatal injuries, per the CDC.
- Those over the age of 65 accounted for 1 in 5 auto accident fatalities, per the NHTSA.
- For adults aged 70 or older, their crash rate per mile traveled is higher compared to every other age group with the exception of teenagers, as noted by the NHTSA.
“Decisions about your ability to drive should never be based on age alone. However, changes in vision, physical fitness and reflexes may cause safety concerns.”
– National Highway Traffic Safety Association
As America’s population continues to age, addressing senior driver safety through vision screenings, refresher courses, and vehicle technology will become an increasingly important part of the national road safety conversation.
Car Accident Statistics by Gender
Crash patterns vary significantly between men and women. Generally speaking, men are consistently overrepresented in fatal crashes, according to the CDC.
Learn about car accident statistics by gender:
- Men are more likely to drive above the speed limit than women, according to the IIHS.
- 20% of male drivers were speeding and fatally crashed. Among females, only 12% were speeding at the time of a fatal crash.
- Men are more likely to drink and drive. The CDC notes that 23% of men involved in deadly car accidents were under the influence of alcohol. For women, it was only 17%.
- More men self-report driving while using alcohol or drugs like marijuana than women.
- Teenage boys are 1.8 times more likely to die in a car crash than teenage girls, per Frontiers in Public Health.
- Young men were one of the highest-risk groups for distracted driving due to factors like cell phone use and changing the radio, according to NPR.
- 35% of male drivers and 18% of female drivers between the ages of 15 to 20 were driving over the speed limit before fatal crashes.
- Men are 3 times as likely to die in road accidents compared to women, according to the WHO.
- Men aged 19 to 29 were also 3 times less likely to wear their seat belts than women, per the Agency for Healthcare Research and Quality.
These patterns reflect both behavioral and exposure differences. Public health campaigns aimed at young men in particular seek to reduce impaired driving and increase seat belt use over time.
Pedestrian & Bicyclist Car Accident Statistics
Pedestrians and cyclists make up a growing share of America’s traffic deaths despite representing a small fraction of road miles traveled.
Explore pedestrian and bicyclist crash statistics:
- 7,080 pedestrians were killed in U.S. traffic crashes in 2024, accounting for nearly 18% of all road deaths, according to TRIP and the NHTSA data.
- Between 2009 and 2023, pedestrian fatalities from car accidents rose by 80%, per the Governors’ Highway Safety Association.
- Pedestrian deaths from car accidents reached a 40-year high in 2022.
- Over 800 bicyclists die every year from car accidents, according to the NHTSA. Rates have steadily been going up since 2010.
- 62% of fatal bicycle accidents involved SUVs or pickup trucks.
- Pedestrian and bicyclist deaths together represented 21% of all U.S. traffic fatalities in 2024. This rate was 19% higher than it was in 2019.
Even as overall traffic fatalities decline, deaths among pedestrians and cyclists have remained stubbornly high. Improvements to crosswalks, lighting, sidewalks, and vehicle designs are among the most urgent priorities in modern road safety.
If you or someone you love was a pedestrian involved in a motor vehicle accident, our lawyers may be able to help your family pursue compensation. Call (800) 995-1212 now.
Seat Belt Safety Statistics
The NHTSA considers wearing your seat belt to be the single best way to keep yourself safe in a car accident. Ejection from a vehicle is typically deadly, but wearing a seat belt locks you in place.
Find out about car accident and seat belt statistics:
- More than 50% of all people who died in car accidents in 2021 alone weren’t wearing seatbelts, according to the CDC.
- 9,758 passenger vehicle occupants killed in 2024 were not wearing seat belts, per the NHTSA.
- Roughly every 54 minutes, somebody who isn’t wearing a seat belt dies in a car crash.
- 59% of adults aged 18 to 34 killed in traffic accidents weren’t wearing their seat belts.
- Seat belts reduce the risk of fatal injury by 45% for front-seat passengers in cars and by 60% in light trucks.
- Seat belts saved an estimated 14,955 lives in 2017 alone, and an additional 2,549 could have been saved if those who died had been buckled, the NHTSA reports.
- 47% of front-seat occupants killed in 2024 were unrestrained, compared to 58% of those killed in back seats.
- 44.4% of drivers and passengers in urban counties didn’t use their seatbelts at the time of a fatal crash, compared to 61.3% of those in rural counties, per the CDC.
- Rural counties had car accident death rates 3 to 10 times higher than urban counties, largely stemming from the failure to use seatbelts, according to the CDC.
Despite decades of safety campaigns, nearly half of all vehicle occupants killed in U.S. crashes are still not wearing seat belts. Buckling up takes a few seconds and remains one of the simplest, most effective ways to survive a crash.
Car Accident Death Statistics
Despite gradual safety improvements, motor vehicle crashes remain one of the leading causes of death in the U.S., per the CDC. More than 120 people die in auto accidents per day in the U.S.
The U.S. has a rate of 12 to 18 road accident deaths per 100,000 people, according to car crash death statistics from the WHO.
Car accident casualties statistics include:
- An estimated 39,345 people died in U.S. traffic crashes in 2024, according to the NHTSA, which was the first time since 2020 that fatalities fell below 40,000.
- Car crashes are among the leading causes of unintentional death for Americans ages 1 to 44, along with accidental falls and opioid overdoses, according to the CDC.
- The U.S. recorded 40,901 traffic fatalities in 2023, down 4.3% from 42,721 in 2022, according to NHTSA’s Fatality Analysis Reporting System (FARS).
- Motor vehicle deaths increased 13% from 2015 to 2024, even as vehicle safety technology improved, per the NSC.
- 45% of car accident deaths in the U.S. involved speeding, drunk driving, or failure to use a seat belt, according to the NHTSA.
- After declining for a 30-year period, the rate of fatal car accidents increased in 2020 and 2021, according to the U.S. Department of Transportation.
- 43,230 people died, the highest number of fatalities since 2005. Death rates started to drop in 2022.
- Up to 2.7% of fatal car accidents involved a defective auto part, according to the Federal Motor Carrier Safety Administration.
- U.S. roadway fatality rates reached 1.10 per 100 million miles traveled, per Reuters. This was the second-lowest recorded car accident death rate in America to date.
Losing someone you love to a tragic car accident can be devastating. At Sokolove Law, we may be able to help you seek justice for what happened. Get a free case review now to learn more.
Economic Cost of Car Accidents
Car accidents cause billions of dollars in expenses. In 2023 alone, more than $457 Billion was spent on medical costs, funeral expenses, and more stemming from car accidents throughout the country.
The financial toll of car accidents extends far beyond medical bills. Every traffic crash creates costs for victims, families, insurers, employers, and taxpayers.
Learn more about the economic impact of car crashes:
- The average cost of a fatal car accident was $11.3 Million with all expenses accounted for, per the NHTSA.
- Motor vehicle crashes cost the U.S. economy an estimated $340 Billion in direct economic costs in 2019, or roughly $1,035 per American, per the NHTSA.
- 75% of expenses stemming from car crashes are actually paid by those not directly affected due to issues like increased insurance rates, taxes, and even environmental consequences, per the NHTSA.
- In 2019 alone, car accidents caused by speeding led to $46 Billion in expenses, alcohol-related car accidents led to costs worth $68.9 Billion, and distracted driving accidents resulted in $98.2 Billion in damages.
- Seat belt use led to projected economic savings of $93 Billion in the same 2019 study.
These numbers underscore why pursuing fair compensation after a serious crash isn’t just a personal matter. It’s a critical part of holding negligent drivers and insurance companies accountable for the true cost of their actions.
Car Accident Lawsuit Statistics
Roughly 5 million car accident lawsuits were filed in various state courts between 2014 and 2023, according to the Insurance Information Institute. The total value of these claims reached $42.8 Billion.
About 52.8% of these car accident lawsuits reached out-of-court settlements, allowing families to get a payout without the need for a trial. Only 7.4% of cases went to trial.
At Sokolove Law, we believe that everyone should have the opportunity to file a car accident lawsuit if they or someone they loved was hurt or tragically passed away.
Our past car accident settlements and verdicts include:
- $3 Million to a Rhode Island woman who was driving a defective car
- $2 Million for a Mableton woman in a coma after being hit by a commercial truck as she crossed the street
- $965,000 to a Massachusetts son driving his mother’s car
- $810,000 for a man whose wife was killed after a vehicle crashed into the ambulance that was transporting her
- $600,000 to a woman who suffered injuries in a car crash
- $205,000 for a New Hampshire couple who were T-boned by a teenager who blew a stop sign
- $400,000 to a client who was in a motorcycle accident
- $175,000 for a Georgia man injured in a car crash
- $600,000 to a woman who was hit by an 18-wheeler in a crosswalk
- $750,000 for a driver who suffered a dislocated shoulder and bruised ribs from a car crash
- $720,000 to a Boston man who suffered a broken leg after being hit by a garbage truck on the wrong side of the street
- $3 Million for a man injured in a car accident

“My experience working with the legal team at Sokolove Law was excellent. It was super simple. They were super professional. Everything was laid out very clearly, and there was no confusion about what needed to be done at all.”
– Matt, Car Accident Survivor & Firm Client
Our compassionate car accident lawyers are standing by to help you. Find out your eligibility right now.
Let Sokolove Law Fight for You
Since 1979, we’ve helped thousands of families secure justice and compensation for injuries caused through no fault of their own.
Sokolove Law: Helping Car Accident Survivors Move Forward
If you or a loved one has been hurt in a car accident, help may be available. When you work with our team, we’ll handle the legal process on your behalf, allowing you to focus on healing and recovery.
Our firm has a national reach, meaning we can help families file car accident lawsuits in all 50 states to hold responsible parties accountable.
At Sokolove Law, we have secured more than $10.6 Billion total for our clients. There are also no upfront or out-of-pocket fees to work with us.
Call (800) 995-1212 now or fill out our contact form to learn if we can help you file a car accident lawsuit.
Car Accident Statistic FAQs
What are the statistics of dying in a car crash?
Your odds of dying in a car crash are currently 1 in 96, according to data from the National Safety Council (NSC). These odds are significantly greater than your odds of dying from simply walking or crossing the street, which sit at 1 in 492.
If somebody you love died in a car accident, our team may be able to help you pursue justice and compensation. Get a free case review now.
What color of car statistically has the lowest crash rates?
White is considered the safest car color, according to AAA. Those driving white cars are 12% less likely to get into an accident, per Reader’s Digest.
The most dangerous car color was black since other drivers may have a harder time seeing these cars, especially at night.
What are essential car accident statistics by age and gender?
Car accident statistics show that men tend to be less safe drivers than women, and that teenagers and older adults get into more accidents.
Here are key car accident statistics by age and gender:
- 8.8% of drivers who crash are teens. Teen drivers are also responsible for 6.8% of all fatal crashes.
- 25 older adults pass away from car accidents each day and 740 suffer injuries, per the Centers for Disease Control and Prevention (CDC).
- Men are 3 times as likely to suffer a fatal car crash compared to women, according to the World Health Organization (WHO).
While some are at a greater risk than others, the bottom line is that anyone can get into a car crash. If you were hurt through no fault of your own, call (800) 995-1212 now to find out if you qualify for compensation.
What are 90% of car accidents caused by?
Over 90% of car accidents are caused by various types of human error, according to Stanford Law School. Human error can mean many things, ranging from simple mistakes to drunk or distracted driving.
You didn’t deserve to get hurt in a car accident — especially if someone else’s mistakes may have caused it. In these cases, it may be possible to file a lawsuit to seek compensation for what happened.
Do lawyers increase car accident settlement amounts?
While there are no guarantees, working with a car accident attorney could greatly increase the odds of your case being successful and recovering higher settlement payouts.
Experienced car accident attorneys in our network handle the work of a legal claim on your behalf, such as collecting evidence, filing a lawsuit, and negotiating settlements with the responsible parties.
Get a free case review now to find out about how much car accident settlement compensation might be available in your case.
Do women cause more car accidents than men?
No. Statistically, men actually cause more accidents than women. The Insurance Institute for Highway Safety (IIHS) notes that significantly more men than women die in car accidents due to factors like not wearing seatbelts, driving while impaired, and speeding.
For instance, 23% of men involved in deadly car accidents were driving while drunk compared to just 17% of women, as noted by the CDC.
What is the #1 cause of car accidents in the U.S.?
Human mistakes are the #1 cause of car crashes in the U.S., accounting for 9 out of 10 accidents per Stanford Law School. Some of those include speeding, distracted driving, and impaired driving.
At Sokolove Law, we can review your situation to determine what may have caused your car accident. We can also work to hold the parties who may have been responsible accountable through legal action.
How many car accidents happen in the U.S. each year?
There are approximately 6 million police-reported car accidents in the U.S. each year, according to the National Highway Traffic Safety Administration (NHTSA). In 2022, about 6.06 million crashes were reported to police, with more than 70% resulting in property damage only.
The remaining accidents resulted in injuries or fatalities, with approximately 2.44 million people injured and 40,901 people killed in 2023 alone.
What are the top 3 causes of car accidents in America?
The top 3 causes of car accidents in the U.S. are:
- Impaired or drunk driving: Drunk driving led to 30% of all deadly car crashes in America. One person every 44 minutes dies from drunk or impaired driving, with 11,904 fatalities in 2024.
- Speeding: This has contributed to 29% of fatal car crashes, more than 11,000 per year, according to NHTSA.
- Distracted driving: 3,208 people died from distracted driving, such as texting, changing the radio, or talking on the phone, in 2024 alone.
Even if you were driving safely, other drivers who were not being safe could be acting irresponsibly. Our car accident attorneys may be able to help you get justice, closure, and compensation.
How many people die in car accidents each year in the U.S.?
In 2024, an estimated 39,345 people died in U.S. traffic crashes, according to the NHTSA — the first time since 2020 that fatalities fell below 40,000. The NHTSA’s early estimates for 2025 project 36,640 deaths, a 6.7% decrease and the lowest annual total since 2014.
Despite these declines, U.S. traffic fatalities remain 8% higher than in 2019 and 21% higher than in 2011.
Which state has the most car accidents?
Texas consistently records the most total traffic fatalities of any state, with 4,150 deaths in 2024, driven by its large population and high vehicle miles traveled. California and Florida also rank near the top in total crash deaths.
However, when measured per capita, Mississippi has the highest fatality rate, with 24.9 deaths per 100,000 residents in 2024. Other consistently high-fatality states include Wyoming, Arkansas, South Carolina, and Alabama.
What state has the lowest car accident rate?
Massachusetts had the lowest car accident fatality rate per 100,000 population in 2024, at just 4.9 deaths. Other consistently safe states include Rhode Island, New York, New Jersey, Minnesota, Hawaii, and Utah.
These states tend to share characteristics like strong seat belt enforcement, well-developed public transit, lower rural mileage, and stricter impaired-driving laws.
How dangerous is motorcycle riding compared to driving a car?
Motorcyclists were almost 27 times more likely to die in a crash than passenger car occupants per vehicle mile traveled in 2024, and 5 times more likely to be injured, according to the NHTSA.
In 2024, motorcyclists made up just 0.6% of vehicle miles traveled but represented 15% of all traffic fatalities.
Wearing a DOT-compliant helmet remains one of the most effective ways to reduce motorcycle injury and death.
Can I file a lawsuit after a car accident?
Yes. If another driver’s negligence caused your crash, you may be eligible to file a car accident lawsuit. Compensation can cover medical bills, lost wages, pain and suffering, property damage, and more.
Each state has its own statute of limitations for filing a personal injury lawsuit, so it’s important to speak with an attorney as soon as possible.
Contact Sokolove Law now to get started with a free case review.
